


Do you know how many deals fall apart, on average, in the B2B tech space? Go on. Have a guess.
It's about 65%. As product marketers, we’re losing a huge chunk of our TAM. We need to understand what's happening, where the pipeline is dropping, and how the stages are progressing in our sales. You might be thinking, “That's not my job. It's its sales enablement or someone from sales leadership who has to figure that out.” But as product marketers, we can help them.
So how can we close the gap between reality and aspiration when it comes to closing deals? How can we build brand loyalty and customer loyalty?
I’d like to talk you through three unique methods I developed with my product marketing team. These methods transformed our conversion rates. Sure, it doesn't happen overnight. It takes some time, but hang in there. It's all about product marketing and trusting the process.
Sales calls
Let’s start with sales calls. You might be thinking, “But we have a process with sales! We speak with them about those important deals every quarter.” But do we talk about the 65% of deals that didn’t make it through? Probably not. So how can we capture that data?
I was just talking over lunch about how Salesforce data is not always so reliable. Sales reps don’t always fill in the right data, and by the time we reach out to them, they’ve forgotten about the deal. The answers we get to our questions about why a deal was won or lost end up getting so filtered that we have to go back to square one. So how can we get the data we need from sales calls?
When I joined Kantara, we were a small growing startup – we didn’t have the budget for win-loss analysis or to bring in a third-party vendor to help us figure these things out. I started asking myself how I could have more cadence with sales and get raw, unfiltered data from them.
We have a sales call recorder enabled in the company. There are a lot of tools out there, but we use Chorus. At the end of each day, I started taking an hour to dive deep into those recorded calls. I didn’t know which direction to take or which sales reps to listen to. I just went in there and started learning the sales process.
When I first pitched this idea to the company, the sales team was not happy with me. They thought I was going to judge them and start interfering with their slides and their processes.
My intention wasn't to do that. My intention was to create empathy towards sales, to get into their shoes and understand what they go through every day while selling our products. I wanted to get that data to the product teams so they could understand that sales are not easy.
We have to understand what our sales colleagues are working with, and we have to take the negative as well as the positive feedback from the audience, not just rely on our beta users.
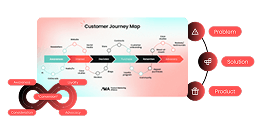
SPIL maps
The second method we used to transform how we close deals is SPIL maps. SPIL stands for situation, pain, impact, and leverage, and it’s an amazing technique because it can work with any sales process in your company.
Let's say we have data from the win-loss analysis, Chorus, our CSM, and our operations team. That’s a lot of data. How can I combine it to build something that will help our customer-facing teams? How can we make sure that our data is up to date, we’re hitting the right challenge, and we’re providing the right materials to our sales reps?
Let’s start with the situation piece. We take trends from all that data – let's say the 10 main trends in a given quarter – and deep dive into each, providing our reps with discovery questions, ideation, data initiation, and how to talk about this particular challenge.
Let’s say we’re having a conversation with a prospect about resource management, which is our bread and butter. We need to make sure that we’re telling the audience that we‘re not just here to provide you with a solution; we’re here to hold your hand and help you through your journey.
The second part is pain – figuring out the emotional and rational pain points for users in those situations. Let's say my user is trying to manage 500 people who are involved in a project.
They’re probably using spreadsheets, which is very time-consuming, and they might not know which skill set each person is bringing to the table. Those are their pain points.
The third step in creating a SPIL map is figuring out the impact of the situation and the pain point. In the previous example, the impact might be that the user can’t deliver their project on time because they don't know who is taking planned time off in the middle of the project.
When you connect these three pieces, you create leverage. This is where your sales reps apply these learnings to selling your product. They not only sell your product; they sell your solution to the problem that your users are facing.
From my experience, a lot of the time companies know what their product is built for, but they lack an understanding of what goes on behind product development: the user journey. SPIL maps can be a great way to connect those dots and make you're not holding on to data, but you're making sense of it and sharing insights.
CBI reports
The third method we created to address customer pains is CBI reports. CBI stands for critical business issues.
We’d taken all this data and all these trends, and provided SPIL maps to our sales reps and client-facing teams, but what about the internal audience? What about marketing? What about the less technical folks who would benefit from these insights? At the end of the day, we’re all working towards the same goals. That’s where the CBI report comes in.
Critical business issues are issues that your buyers are coming to you with, in the hopes of finding a solution. We never intended to create a report, but people started using it so much that we realized this had to be shared with other product marketers out there.
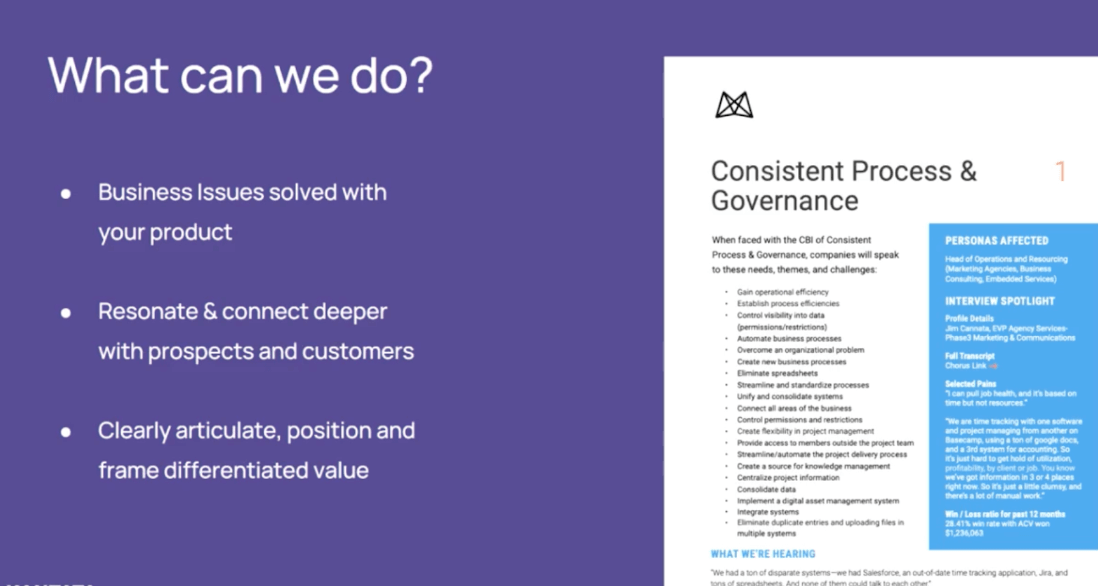
This report consists of a lot of different sections. You can provide win-loss data; that way, you're talking numbers, and your teams can understand the dollar value of the issue. You should also provide selected pain points.
We highlighted a few keywords and themes so that whenever someone internal was talking to a prospect or trying to solve a client problem, they’d be able to quickly figure out exactly which critical business issue was being raised.
We also included exact quotes that we heard in Chorus and links to recorded sales calls so that people can hear how we won those deals. That helped our teams not just trust product marketing but also trust in the process.


Product marketing insider
Thank you for subscribing
Level up your product marketing career & network with product marketing experts.
An email has been successfully sent to confirm your subscription.
 Follow us on LinkedIn


.svg)
Start the conversation
Become a member of Product Marketing Alliance to start commenting.
Sign up now