


Ever had that feeling of being completely overwhelmed when you look at your product analytics? Like you need a data science qualification to figure out what your analytics is trying to tell you?
Well, if you’re a Product Marketing Manager (PMM) and product analytics has ever given you that sense of vertigo, you’re not alone.
Good news: there’s an easy explanation as to why. You’re looking at the wrong type of product analytics for the PMM role.
This article is all about why PMMs need to focus on goal-based product analytics, and how that will put you back in control of your numbers.
In this article, we’ll focus on key topics of discussion, including:
- What do you mean by “the wrong type of product analytics”?
- Where does marketing analytics fit in?
- What KPIs should I be measuring?
- How do “Who?” analytics let me track those KPIs?
- How do I dig deeper with “Who?” analytics?
- What am I supposed to do with all that data?
- How can “Why?” analytics help me?
We'll cap things off by wrapping it all up in our summary.
What do you mean by “the wrong type of product analytics”?
Product analytics covers all kinds of data about how users are interacting with your product.
While all of that data is (potentially) useful to somebody, a lot of it is not going to help a PMM.
Let’s break product analytics into three basic types:
- “What?” analytics: Comprehensive, quantitative data that presents the big picture, such as recording every click and interaction, providing a “bird’s eye view” - a statistical account of what all users are doing in your product.
- “Who?” analytics: Track individual users’ journeys through specific funnels within your product and report on how users or user segments are hitting certain milestones
- “Why?” analytics: data that provides insight into the behavior of particular users to help you work out why they are doing certain things.
“What?” analytic tools - like Heap, Amplitude and Mixpanel - are of greatest use to Product Managers since they are concerned with the creation and development of products as a whole.
They own the product and the roadmap.
Their roles mean that they need to know everything that’s going on inside their products and how users are engaging with specific parts of it.
Product Marketing Managers sit at the intersection of product, sales and marketing. Their work is about communicating with users to help them get their job done through repeated usage of the product's features.
So if a PM asks “does this solve users’ problems?” PMMs ask “how do I make users understand that this solves their problems?”
PMMs therefore need to focus on “Who?” analytics in the first instance, with “Why?” analytics (using tools like Hotjar and FullStory) in a supporting role.
Where does marketing analytics fit in?
Compared to product analytics, marketing analytics focus on different parts of the user journey- mostly the acquisition stage.
Most of that journey from total ignorance of your product to conversion into a new user (or trial user for SaaS products) takes place outside of the product itself: on your site, in search, on social media, even offline.
Obviously, it matters to PMMs where new users are coming from, how they get there and how much it costs to acquire them.
But that’s not all PMMs care about.
They also care about turning new users into committed, regular, fully paying, long-term users through:
- Making sure they experience “Aha!” moments and realize value quickly
- Encouraging activated users to keep using the product and keep getting more and more value by using a wider range of features
- Continuously collecting feedback and acting on it to improve the experience
Most of this needs the PMM to be watching what users are doing inside the product - to target where they are along their user journeys.
Marketing analytics gives you insight into the top of that funnel, but to optimize the distance and speed of travel through the later stages, you need goal-based product analytics.
What KPIs should I be measuring?
In our experience, the most important product analytics KPIs are:
Customer Acquisition Cost (CAC) - total sales and marketing expenses / new customers acquired
Activation Rate (%) - (users reaching your Activation Events / users signing up) x 100
Average Time To First Value (TTFV) - average days it takes a user to reach Activate
Active User Rate (%) - (users from a given cohort or segment with a high Customer Engagement Score / total users from the same cohort of segment) x 100
Daily Active Users to Monthly Active Users Ratio - DAUs divided by MAUs gives you an idea of how sticky your product is, ie how frequently users are coming back
Feature Adoption Rate (%) - (MAUs for a given feature / logins in a set period) x 100
Churn Rate (%) - (customers lost in a given period / users at the start of that period) x 100
Customer Lifetime Value (CLV) - Average Revenue Per Account (ARPA) / Churn Rate
Visitor to Signup Rate (%) - (signups / visitors on the signup page) x 100
Signup to PQL Rate (%) - Product Qualified Leads / signups) x 100PQL to Customer Rate (%) - (customers/ PQLs) x 100
How do “Who?” analytics let me track those KPIs?
PMMs are interested only in those touchpoints that affect movement along the user journey.
This is where goal-based “Who?” analytics is essential.
Let’s take the Activation Rate KPI we mentioned in the last section:
- You need to know what your Activation Events are - what are the key actions a user must take in order to experience the value your product offers? Userpilot, for example, defines an Activated user as someone who has:
- Downloaded our Chrome extension
- Installed our code snippet in their product
- Created an experience
- Deployed that experience
- Set your analytics tool to track users hitting those events.
- Divide users hitting this goal in a time period by new users in the same period to get your Activation Rate
So, success with goal-based product analytics is all about identifying and refining those combinations of trackable events which you can be confident add up to a goal reflecting user journey progress.
One of the main reasons why PMMs often look at product analytics and don’t know where to start is that they don’t have clear definitions of what all these events and goals are to hand.
This is where a tracking plan is vital.
A tracking plan is just a big spreadsheet spelling out:
- All the events you need to track
- How they should be bundled up to constitute goals
- How those goals correspond to user journey progress.
When you have a tracking plan like this, it’s really easy to amend and adjust your goals in the light of new data:
- Showing that there are other factors that influence user journey progress besides the ones you choose when you first configured your analytics package
- As new use cases become apparent with their own, distinct journeys
- As you update and revise your product
Without this data to hand, you may find yourself relying on out-of-date or inaccurate goals - tracking and optimizing against the wrong things - or you may have to do a lot of reverse engineering to figure out why things are not working out as they should.
Your tracking plan is also a great help when it comes to assessing the best product analytics tool for your app.
If a tool can’t track the events you need to watch or it’s not easy to adjust your events over time, don’t waste your money and time on it.
How do I dig deeper with “Who?” analytics?
In short, use segmentation.
Let’s consider the Activation Rate again.
It’s hard to do very much with your global, user-wide Activation Rate. That figure includes all users, all use cases, all marketing sources, all geographical territories, all demographic and psychographic groups etc.
And considering the path to activation is different when it comes to different use cases, you can't really measure the success of your marketing efforts unless you look at data across separate user segments.
PMMs need to remove the barriers that prevent users from smoothly following the ideal user journey that leads them to value fast.
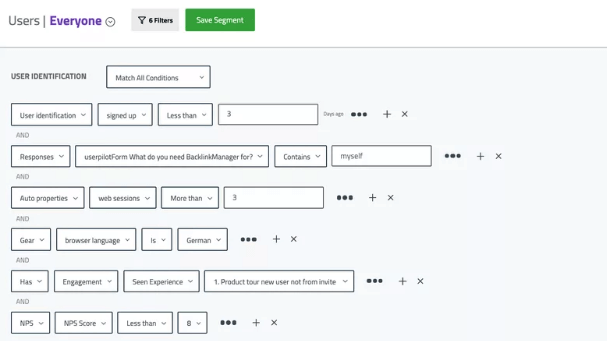
To do that, always segment your users to look at more relevant and actionable data.
Good goal-based product analytics tools will always feature advanced segmentation capabilities that:
- Allow you to define your own custom segments
- Combine user characteristics with time factors, use cases and usage history in defining those segments
This way you'll always know who did what and which segment of users needs your attention the most.
This is what a custom segment can look like:
What am I supposed to do with all this data?
This is where the magic happens!
Figuring out what to do when you see that one segment is not hitting goals at the same rate as others is where the PMM role gets creative.
For example:
- If your analytics shows that users signup and then don't engage - simplify the workflow to remove friction and look into improving the onboarding experience
- If user activity levels are dropping after the first few days - schedule email alerts offering value to re-engage them with your app
- If users are failing to realize value quickly- use a product tours tool an build in-app guidance to help users discover and engage with your product
- A/B test different solutions within single segments to see which performs better
The possibilities really are endless.
How can "Why" analytics help me?
We’ve hardly mentioned the “Why?” analytics tools like Hotjar and Fullstory in this article.
That’s not to suggest that they’re of no use to PMMs.
On the contrary: screen recording tools like these can be really helpful in unblocking PMM minds stuck on the problem of “these users are underperforming - but what am I going to do about it?”
If your goal-based analytics tools have shown you that a particular segment is struggling to achieve a particular goal, it can make all the difference to sit and watch back a series of individual user sessions to see precisely where things are going wrong.
Maybe you’ll see some users are very hesitant, moving their cursors around a lot before they click on anything. Perhaps they’d complete tasks more quickly and reliably if you simplified the navigation controls?
This is where “Why?” analytics tools excel: in helping PMMs to figure out why users are doing things, so that they can intervene to help those users get better results, faster.
But on their own, session recordings can be a rabbit hole.
They can help you understand and act upon goal-based data, but by themselves they’re almost as confusing as the bird’s eye view approach we dismissed at the start.
Summary
Product analytics tools fall into three categories: “What?” tools, “Who?” tools and “Why?” tools.
- The ''What'' analytics tools (Heap, Amplitude, Mixpanel): used for quantitative data collection on everything the user is doing
- The ''Who''analytics tools (Userpilot, Appcues, Pendo): goal-based analytics telling you which user has performed specific predefined actions, based on predefined segments, goals and custom events
- The ''Why''analytics tools ( Fullstory, Hotjar): qualitative analytics like session recordings that lets you understand usage patterns and identify why users may be running into issues
- Goal-based “Who?” tools are of central importance to PMMs’ work. The others are less
- PMMs need to track users’ movement along the user journey. This involves multiple KPIs at different points.
- Goal-based product analytics focuses on identifying and tracking the in-app events you define that reflect or add up to user journey progress. A tracking plan is a vital help here.
- To get the best out of product analytics, you need to segment users in sophisticated ways and track differences in goal achievement between segments.
- Those differences enable PMMs to hypothesize solutions that will improve user results - and if you’re struggling, “Why?” analytics tools can really help understand user behavior.


Product marketing insider
Thank you for subscribing
Level up your product marketing career & network with product marketing experts.
An email has been successfully sent to confirm your subscription.
 Follow us on LinkedIn


.svg)
Start the conversation
Become a member of Product Marketing Alliance to start commenting.
Sign up now