


When you say “growth,” people usually think of money, progress, success, or revenue, but growth is not about any of these. Growth is all about the process.
The good news is that there’s a framework you can apply to build sustainable growth. Products and markets can be unique, but achieving growth isn’t unique at all. It doesn't matter whether you're building a B2B or B2C product; there’s a clear process you have to build and apply to your business, products, and teams.
The playbook I’ll be sharing today is based on my experience, my team's experience, and the products I'm working on. It consists of three key items:
- Finding and measuring product-market fit,
- Building and scaling functional growth teams, and
- Scaling via testing and experiments.
Let’s take a closer look.
Step one: Find and measure product-market fit
Getting to the product-market fit is the only thing that matters. It's not possible to build a company if you haven’t found your product-market fit, but what is it? And how do you know you’ve found it? The truth is that product-market fit is a clear and measurable entity, and how you measure it is the same for every company. Let's dive in.
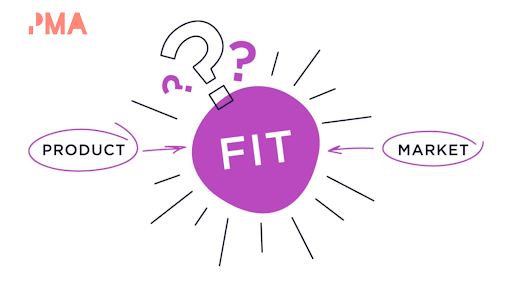
So, you have your product, you have your market – what's in between? If we say that the product is a combination of value proposition, features, and user experience, while the market is defined as users and their needs, the fit lies in bridging the gap between the product and the market by achieving the following:
- It’s clear who the target customer is, and you bring those customers in.
- It’s clear which specific customers’ needs your product is to serve.
- Your value proposition gets traction.
- Your product has the right features to serve the needs of your target customers.
- Customers can easily understand how to do what they want to do when interacting with your product.
If these five statements are true, you’re in the right market with a product that can serve it. It’s important to understand that those steps aren’t in any particular order – they’re all equally important. If even one of these statements isn’t true for you, you might not achieve product-market fit.
What to measure
Although the checklist above is straightforward and difficult to argue with, it doesn't help you understand which metrics you have to monitor so you can see whether you’ve got product-market fit.
 Aicha Zaa
You can experiment endlessly with your value proposition and validate hypotheses to understand which features are important and which aren’t. You can proudly announce the winners of A/B tests and debate the criteria of the next MVP, but if you don’t measure the impact on activation, engagement, retention, and customer loyalty, you’ll end up building a product for the sake of it, while the ultimate goal should be to build a product that a lot of customers want.
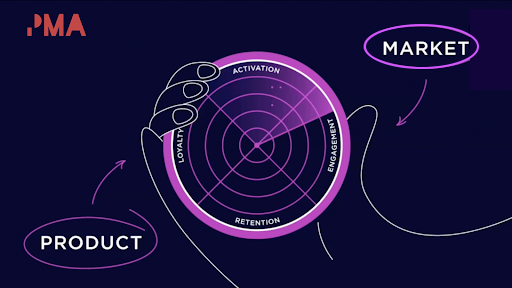
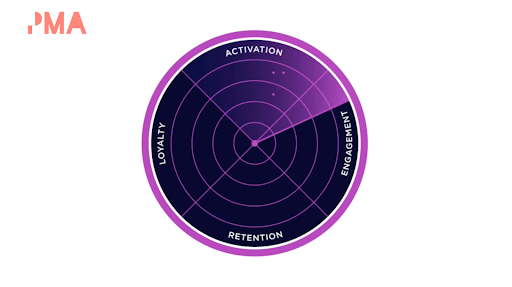
To answer the question about what to measure, you need to keep the customer on your radar by paying attention to these four key areas:
- Activation: Are new users becoming active users?
- Engagement: How engaged are your active users?
- Retention: Are you giving your users enough reason to come back?
- Loyalty: Are your users happy enough to become your promoters?
So which is most important – activation, engagement, retention, or loyalty? What should you focus on first? Well, building a product that a lot of customers want isn’t a single-variable problem, so you have to pay attention to all four areas. Let's dive into each one.
1. Activation
Activation is the moment when a new user takes a specific action to get value out of a product. In Instagram’s case, for example, that action might be posting a certain number of photos or following a certain number of people. For other products, activation could be defined as signing up, making your first transaction, viewing three videos within a specified period, and so on.
An activation metric answers the question, “What percentage of new users have experienced the value of your product?” The percentage of new users who have experienced your product value is the number of specific actions divided by the number of new users. For example, 100 completed first purchases divided by 1000 new users would mean that 10% of new users got the value of your product
Now, how do you identify your activation metric? It’s your job to define the milestone that drives long-term product usage. What’s the number one most important experience that users should be getting in the product? Do not try to guess. A good way to start is to analyze user behavior to find out what returning users consistently do in your product.
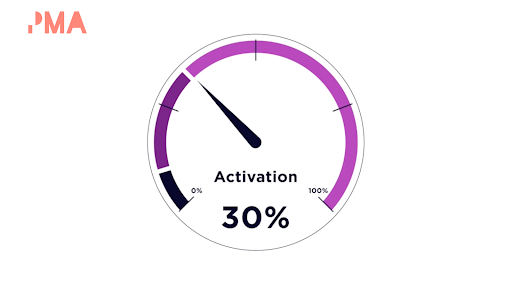
Once you’ve identified your metric, you want to set a benchmark activation rate indicator. I would recommend starting with 30% as a benchmark activation rate and then checking whether that’s the right number for you. A negative rate might be less than 10%, and a positive rate would be anything exceeding 30%. But, again, you can start with this benchmark and then see what makes sense for your product.
2. Engagement
The second dimension on our radar is engagement. Engagement rate is a measure of users' commitment to your product, and it’s a good indicator of whether they find real value in it.
To measure the depth of engagement per user, you have to divide the number of key actions by the number of active users. For example, if I’m running a music streaming service and 10 million songs are listened to by my 100 million active users, I have an engagement rate of 10%.
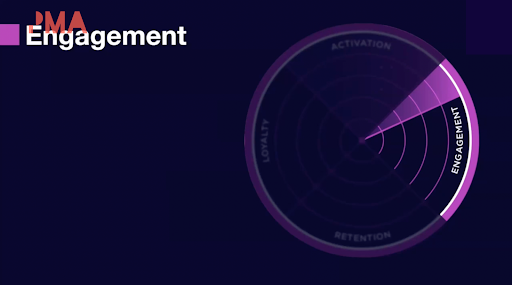
Now it’s time to decide what a positive engagement rate looks like, and again that’ll depend on your product. You might want to set a benchmark of 50% and then create goals for improvement, with negative engagement being anything lower than 20% and positive engagement being anything exceeding 50%.
3. Retention
The third dimension on our radar is retention. Your retention rate answers the question of how many of your active users returned to the product over time. It helps you understand whether you’re giving your users enough reasons to come back and whether you’re bringing the right users in.
To measure your product's retention, you have to use a retention curve. Let's say we’re analyzing users who started using product A for the first time on January 1st, and we're tracking them to the end of the month.
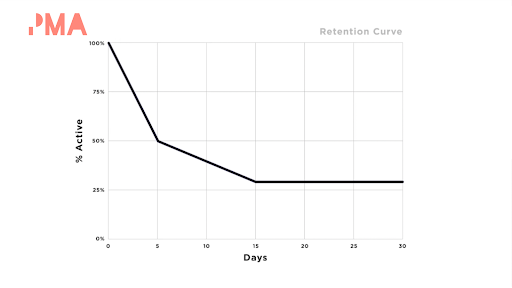
According to this retention curve, on day five retention is 50% – this means that half of the people who first used the product on January 1st came back and were active on January 6th. At first glance, it looks like a huge drop-off, but we can see that the curve stabilizes at 30% on day 15, so we can say that product A has a product-market fit for this particular cohort.
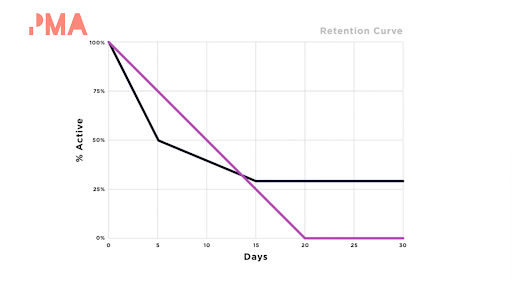
Your retention metric can also show you if you have a product-market fit problem. For example, product B's retention trends to zero pretty fast, which means that it doesn’t give users enough reasons or value to return and take those key actions within the product. Product B hasn’t found a product-market fit.
It’s important to mention that before building a similar graph to measure your product's retention, you need to make sure that you have defined clearly two things:
- Key actions: The actions that you want your users to take every time they come back to your product.
- Usage interval: The frequency (daily, weekly, monthly, etc.) at which you expect people to use your product.
4. Loyalty
The fourth dimension of the product-market fit radar is not to check whether your customers have established a habit around your product, or whether you give them enough reasons to come back to your product over time – this one measures how loyal your customers are.
Measuring customer loyalty helps you know whether you have enough enthusiastic customers who recommend your product to other potential buyers. Why is this important? Mainly because loyal customers are less likely to look around for an alternative solution and are more likely to become your growth engine by recommending your product to their peers.
Steve Norall
Let’s take a look at how we measure customer loyalty. Some companies associate loyalty with revenue-related metrics like customer lifetime value or repurchasing levels. Others prefer to look at the customer loyalty index, which comes from customer surveys. But when thinking about customer loyalty and trying to understand whether you've built a product a lot of customers want, in our opinion, net promoter score (NPS) is the best metric to apply.
NPS is measured with a single-question survey. The question is, “How likely is it that you would recommend product X to a friend or colleague?” Respondents give a rating between zero (not at all likely) and 10 (extremely likely), and depending on their response, they fall into one of three categories: detractor, passive, or promoter.
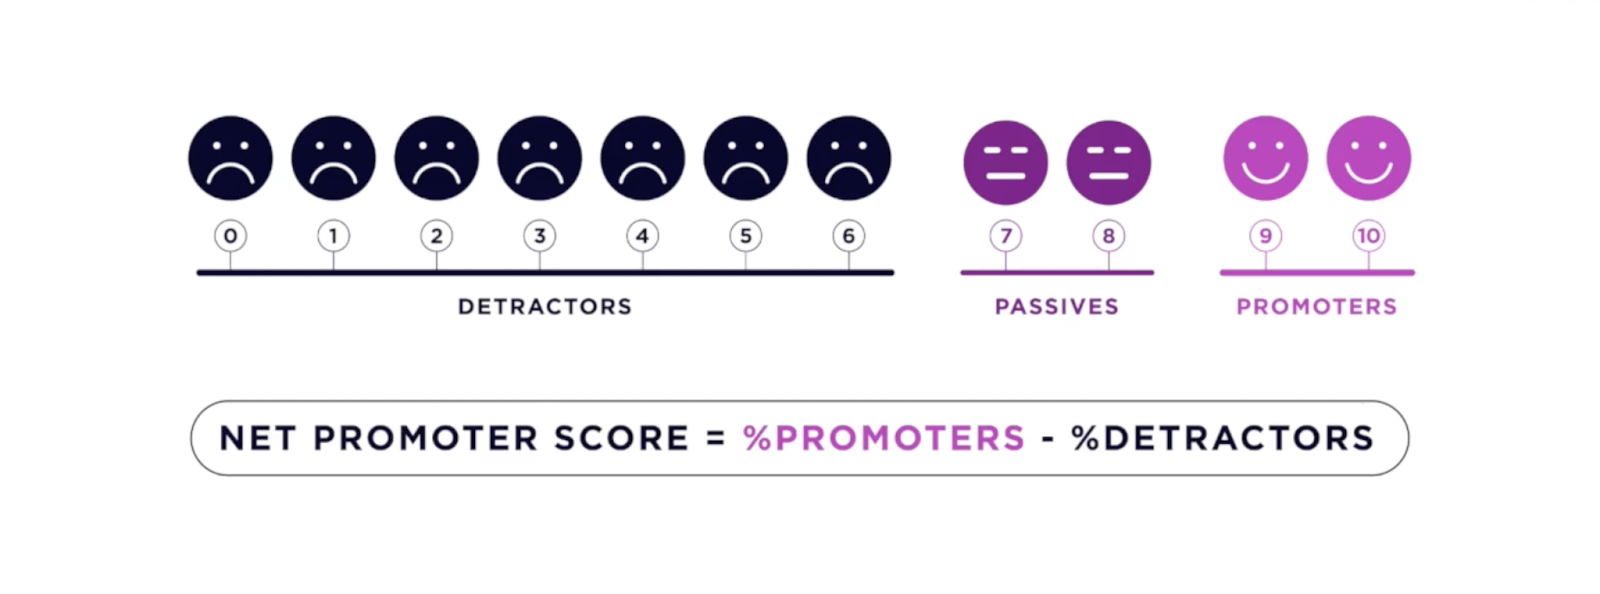
Those who give ratings of nine and 10 are promoters – loyal, enthusiastic customers, who’ll recommend your product to other potential buyers. Those who put seven and eight are satisfied customers but not happy enough to be considered promoters, so we classify them as passive. Those who give a score from zero to six are unhappy customers who are unlikely to repurchase your product and could even damage your product's reputation – we call them detractors.
To determine your NPS, you have to subtract the percentage of detractors from the percentage of promoters. This will give you a score between -100 and 100.
Now, what is a positive NPS? Again, there are a bunch of benchmarks you can find on the web, and it varies by industry, but for software and applications, 30 is an average score. You can compare other companies’ NPS to set your goals, but more importantly, you should constantly experiment with ways to build an experience that creates promoters.
Why these four metrics?
To summarize the first part of our playbook, you’ll know you have a product-market fit when these four statements are true:
- Users have experienced the value of your product, which means activation is happening.
- Users find value in your product, which means engagement is happening.
- Users are given enough reasons to come back, and they do come back to the product over time, which means retention is in place.
- Users are enthusiastic and willing to recommend your product to other potential buyers, which means you have customer loyalty.
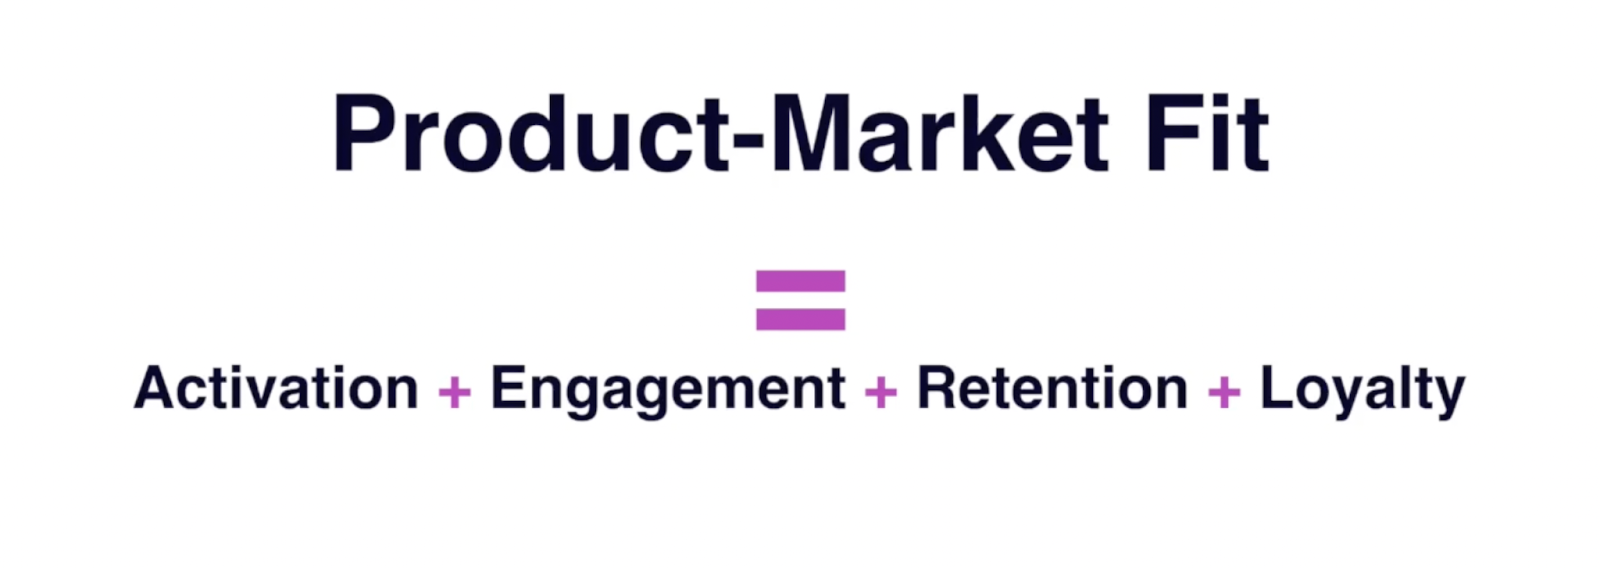
Or, more simply put, product-market fit = activation + engagement + retention + loyalty.
When you have your customer on your radar and you're tracking these four key areas, you can quantify your product-market fit. This makes it much easier to manage and discuss with your teams.
Now, why should you track these four metrics? Well, none of them is a vanity metric. They are all about the customer, they’re all about the value of your product, and they’re all actionable and measurable.
Step two: Build and scale functional growth teams
Now that we know the first step in our playbook on building sustainable growth strategies, it’s time to move on to the second step: building and scaling functional growth teams. But what is a growth team? The short answer is that it's a self-contained team that owns and drives business metrics through rigorous testing practices. You need to have these teams if you want to grow.
A growth team should contain the following roles:
- A product manager to lead and set the culture and direction of the team.
- T-shaped marketers with a broad understanding of how the marketing function works and expertise in at least one channel.
- Designers who can use their expertise to create quick mock-ups and experiments. They don’t need to be perfectionists.
- Engineers who are experiment-driven and passionate about growth.
- Data analysts to help design tests and quickly extract insights. Without these folks, it's difficult to draw conclusions that help you understand how you're doing.
Step three: Scale via testing and experiments
Great news! You’ve got product-market fit, and you’ve got a growth team with all the skills you need to take your business to the next level. Now it’s time to start scaling that business through testing and experiments. There are five steps you have to follow:
- Discovery
- Prioritization
- Design and execution
- Measurement
- Learning and insights
These five steps are logically ordered. First, you have to discover what you're going to be testing, then you prioritize the best ideas you have for the tests. Next, we have design and execution; this is when your growth team carries out the experiments. That’s followed by measurement when your data analysts calculate the results. Finally, you’ll extract insights that you can implement in the product or use as the basis for another test.
Summary
Let's summarize. You can build a product that a lot of customers want, which translates into building a sustainable growth strategy, by following this playbook:
- Find and measure product-market fit by tracking activation, engagement, retention, and loyalty.
- Build and scale functional teams with mixed expertise in marketing, product, engineering, data analysis, and design.
- Scale via testing and experiments, where you discover, prioritize, and execute tests, then measure the results and extract insights for the product development product roadmap.
That’s it – just three steps. I hope you can return to your offices and implement this playbook, then watch as your business grows.
This presentation was delivered at the online Product Marketing Trailblazers event in 2021. Catch up with a variety of talks with our OnDemand service.


Product marketing insider
Thank you for subscribing
Level up your product marketing career & network with product marketing experts.
An email has been successfully sent to confirm your subscription.
 Follow us on LinkedIn


.svg)
Start the conversation
Become a member of Product Marketing Alliance to start commenting.
Sign up now