


In my 20 years of UX design experience, I’ve learned that A/B testing should be the key element of any product marketing strategy. Since it provides marketers with actionable data about the user experience and the ways to improve it, A/B testing is a great way to experiment with bigger or smaller changes before going “all in”.
However, A/B testing is only as powerful as the metrics you use to track your success. The right KPIs are what can turn a good idea into an effective A/B test.
In this article, I’ll share some tips on how to pick the most meaningful measures and what pitfalls to avoid when choosing the KPIs for your A/B experiments.
In particular, I’ll focus on:
- What A/B testing is
- Identifying a hypothesis
- Defining test metrics
- Which KPIs to measure
What is A/B testing?
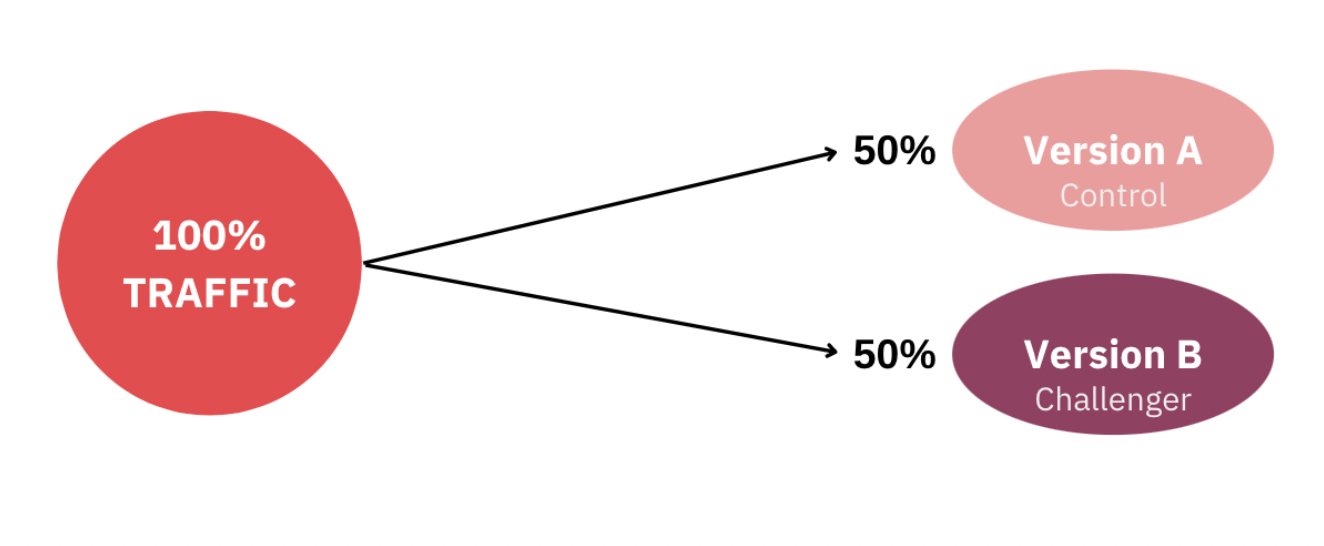
A/B testing, also known as split testing, at its most basic is a way to compare two variations of something to determine which performs better. For product managers, the method is most often associated with websites and apps and its purpose is to find the best ways to improve a product.
To set up an A/B test, you create two versions of content, format, or a design with changes to a single variable. For example, one version has a bigger CTA button than the other. Part of your audience will see one version, while the other part will see the other.
The version that improves your KPIs the most is called the “winner” and if you implement the changes of this variant, you will be able to improve the user experience and boost your ROI.
Here are some examples of A/B testing use cases in product marketing:
- In-app messaging – Display different versions of your product messaging to identify which resonates the most with your users.
- Onboarding flows – Experiment with different call-to-actions, tutorials, or progress bars to discover which version helps retain more users.
- User feedback surveys – Try different question types and survey lengths to find out what type is more engaging to your users.
- Landing pages – Compare two slightly different versions of the same page.
- Design – Test design elements like colors, typography, shapes, and more.
A/B tests can help product marketers make data-driven decisions that lead to enhanced customer experience, increased retention, and revenue growth.
However, you need to remember that it’s a very goal-oriented process, so defining a strong hypothesis and appropriate test metrics is crucial for the experiment to be successful.
Identifying a hypothesis
The first step towards a successful A/B testing campaign is identifying the hypothesis. Be sure to create a hypothesis that states clearly what is being changed, what you believe the outcome will be, and why you think that’s the case.
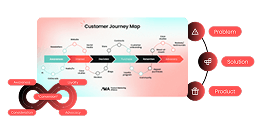
Essentially, a good hypothesis is made up of three components: a definition of a problem, a proposed solution, and metrics that’ll help you measure results. You can use this simple formula to come up with a strong hypothesis that will help guide your A/B testing process:
Changing (the element being tested) from ___________ to ___________ will increase/decrease (the defined measurement) ___________ because (the rationale behind your hypothesis) ___________ .
Here’s an example of such a hypothesis:
Adding information about the benefits of my product above the fold will decrease the bounce rate because users will immediately understand the relevance of the offer.
As you can see, in order for the A/B test to succeed, you should formulate the KPIs as clearly as possible and include them in the hypotheses. Next, I will share the main tips for defining your test metrics.
Defining test metrics
In any test, there can be a vast amount of things you could measure but the solution isn’t to simply track everything. If you measure too much, you might end up being flooded with data that doesn't have any value.
However, measuring too little can lead to missing valuable insights. When it comes to A/B testing, it's helpful to divide metrics into primary and secondary data to ensure you measure the right things for each test.
Primary metrics
The primary metric is your most important KPI that aligns with your business goals. It can be a sale, an order, a subscription, or a lead generated.
This KPI will be the key measurement that determines if your test succeeds or fails. It's often called the North Star metric as it guides you in achieving long-term goals and company improvement.
To determine this metric, have a close look at your company’s goals and ask yourself – what can help the company grow in the long term?
For example, if you own a subscription site and want to test whether providing clear pricing information on the landing page is beneficial for your business, you might want to look at conversions as your primary metric instead of click-throughs as that's what actually indicates an increase in subscriptions.
Secondary metrics
The winning version of each test will be determined by the primary metric, however, tracking secondary metrics or micro-conversions can offer another layer of insights.
Your tests can have many different effects and change how users interact with your site, so measuring your tests at a deeper level than the primary metric can uncover changes in user behavior and help you learn more about your audience.
For example, if you change the color of the button, you might increase the number of clicks, but it might turn out that it harms the number of items added to the basket as users delete the items once they see the total sum. Here the secondary metric to track could be deleted items in the basket.
Remember, often the real learning of an A/B test is not merely whether a variation “worked” or not, but what you can learn about changes in user behavior which can inform new hypotheses and further tests.
Which KPIs should I measure?
The best way to determine good KPIs is to think back and look at the whole user journey. When you make a change on your website or app, think about the goal of that change. Is it for users to add more items to their carts? Or do you want them to spend longer looking at a certain page?
While some A/B tests call for such well-known KPIs as the conversion rate, there’re also other interesting metrics to look at, like how long visitors spend on a page, and what is the scroll depth or page views per visit.
Here are some examples of common KPIs that are worth measuring:
Conversion rate
A conversion is whenever a website visitor performs a desired action. It can be logging in, subscribing to a newsletter, downloading an app, or making a purchase. You can calculate the conversion rate by using this formula:
Total number of conversions / Total number of sessions * 100 = Conversion Rate
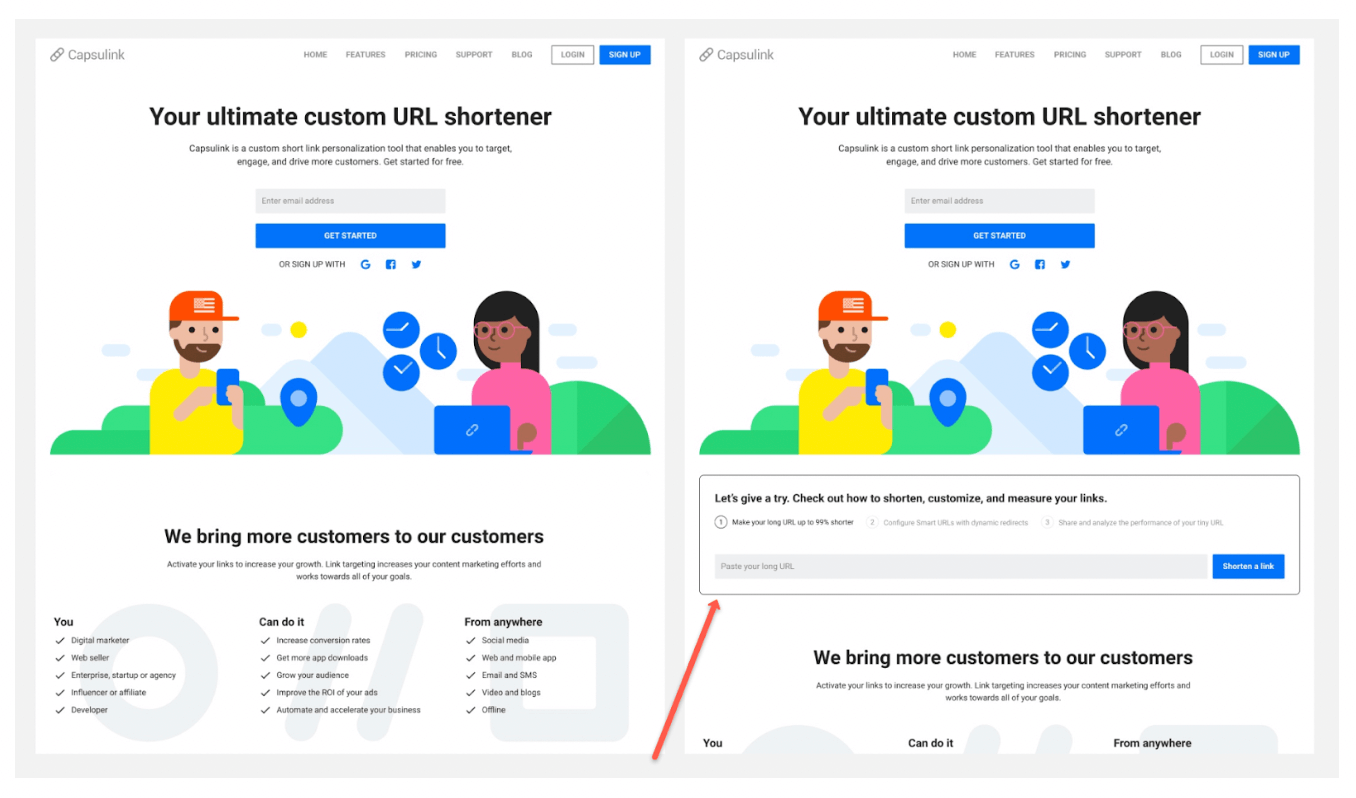
For example, URL shortener Capsulink A/B tested an element that allowed its users to try out the service already on the home page. Their conversion goal was to increase subscriptions and the improved version of the page boosted the conversion rate by 12.8%.
Click-through rate
A click-through rate (CTR) is the number of clicks by unique users divided by the number of views by unique users. For example, you can test different versions of a button on the product page (e.g. “Buy Now” vs “Shop Now”) and measure which version receives the highest CTR.
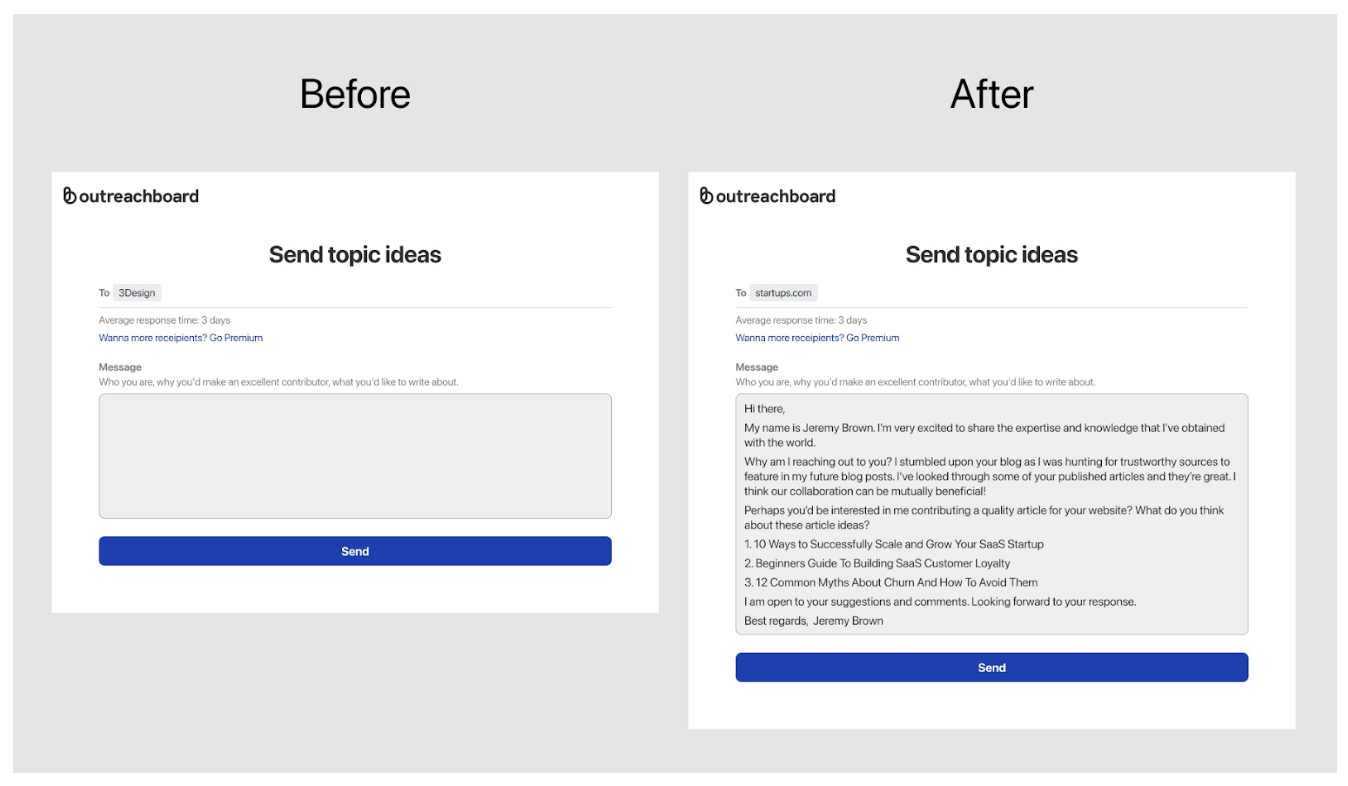
In this example, Outreachboard tested whether offering its clients an email text template that automatically fills in the topics and the name of the author would increase the number of sent emails. The results showed that the click-through rate on the “Send” button increased by 4.2%.
Leads
If you’re A/B testing a landing page for a lead magnet, the goal of this page is to get visitors to convert. Therefore, your winning landing page would be the one that generates more leads.
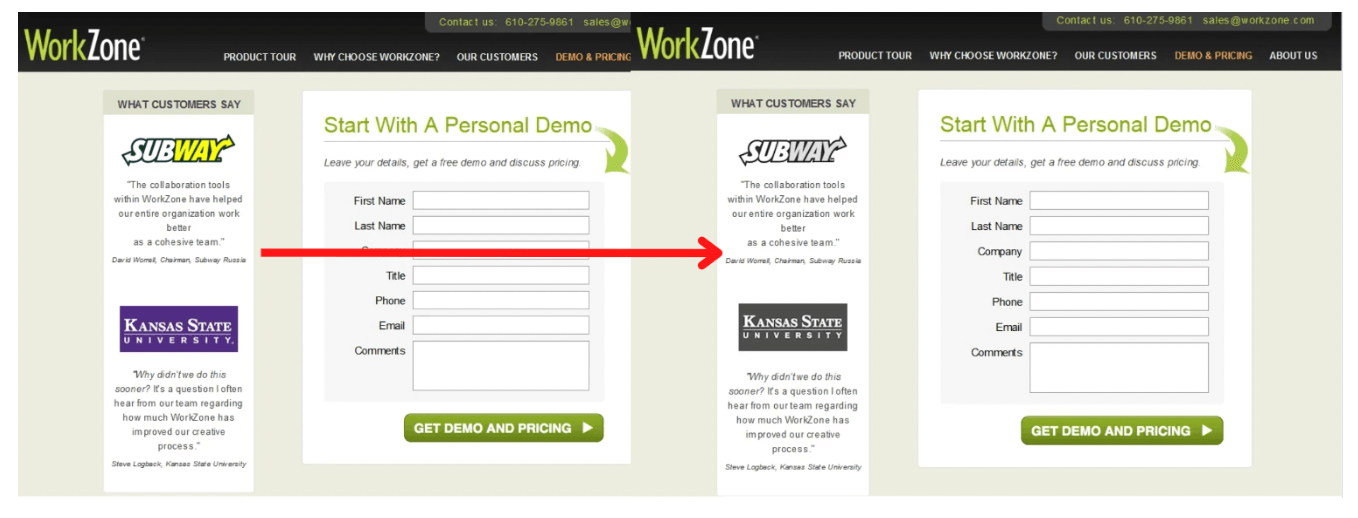
For example, software company WorkZone realized that customer testimonial logos were overshadowing the sign-up form, so they decided to change customer testimonial logos to black and white, and see whether the change would help increase the number of demo requests. The A/B test resulted in a 34% increase in form submissions.
Average session duration
One of the essential metrics for user engagement is the average session duration. This is basically the average amount of time your visitors spend on your website from the moment they enter it until they leave.
Google Analytics calculates it by dividing the total duration of all sessions during a specified time frame by the total number of sessions during that same time frame.
You can use A/B testing to make some changes to a page and see which results in increased session duration. Some experiments you might want to run to improve this metric are including videos, breaking up the text with images, or formatting the text in shorter paragraphs.
Bounce rate
If a user ‘bounces’ from a website, they leave it before interacting with the site in some way. The bounce rate is calculated by dividing the number of visitors who leave a website after only visiting the landing page by the total number of visitors to the site.
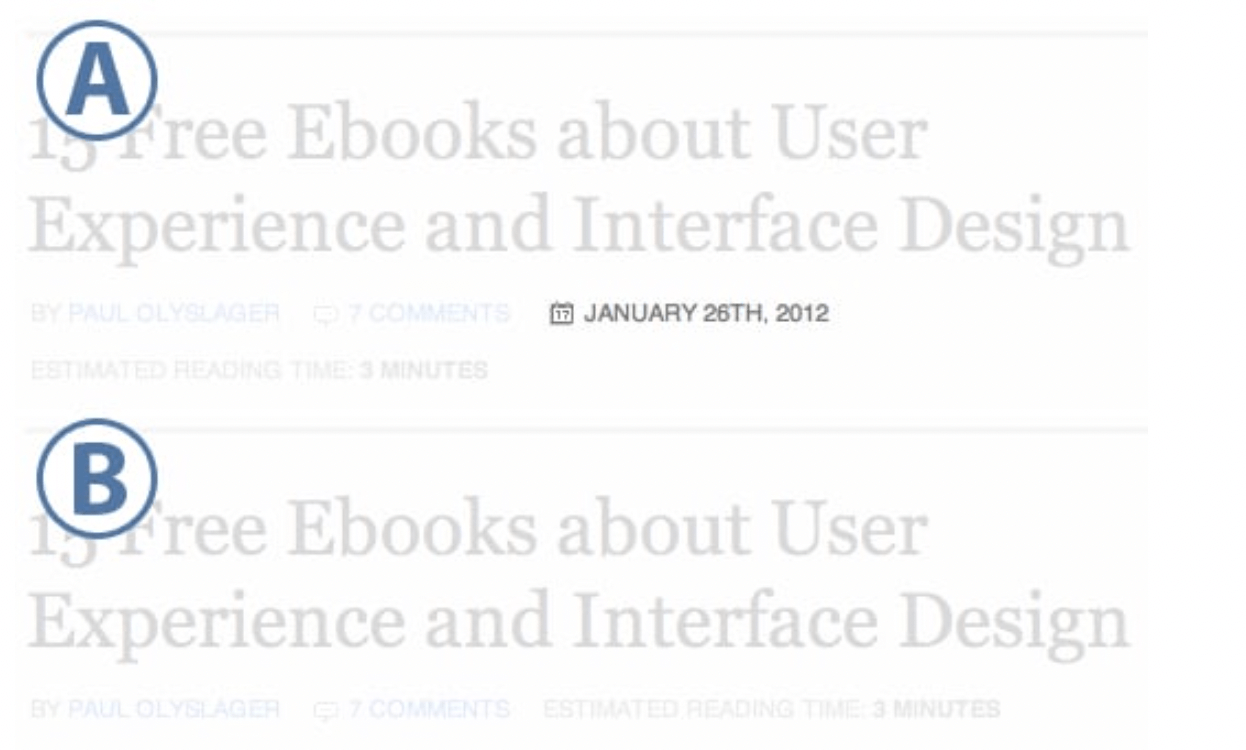
For example, UX designer Paul Olyslager tried testing whether hiding the publication date of his articles would reduce the bounce rate. His test results showed that deleting the date reduces the bounce rate by 12%.
Transaction rate
For eCommerce companies where transactions are involved, it’s crucial to track transaction rates when conducting A/B tests. You can calculate the transaction rate using this formula:
Total Transactions / Total Unique Visitors = Transaction Rate
By increasing the transaction rate, your business gets more revenue, making this an important metric to track if you’re optimizing your business for growth.
Some A/B test ideas for boosting your transaction rate include testing product highlights, checkout page structure, delivery options, and payment methods.
Average order value
In addition to transaction rate, the average order value (AOV) plays an important role in impacting an eCommerce company’s bottom line.
You may choose to use AOV as the primary KPI if you want to better understand your customers’ purchasing habits. You can calculate AOV with this formula:
Total Revenue / Total Transactions = AOV
For instance, you can use A/B testing to compare your original shopping cart against a variation that includes a “People who bought this also bought this” message to see if AOV goes up.
Revenue per visitor
It’s easy to assume that the higher the percentage of visitors who buy something, the better.
However, if they’re all spending less, you’re actually not better off. Increasing conversion rates is easy if you, for example, reduce your prices by 90%, but that’d kill your revenue.
This is why tracking revenue per visitor (RPV) is important. It’s a metric that measures the amount of revenue generated each time a user visits your site. You can calculate it with this formula:
AOV x Transaction Rate = RPV
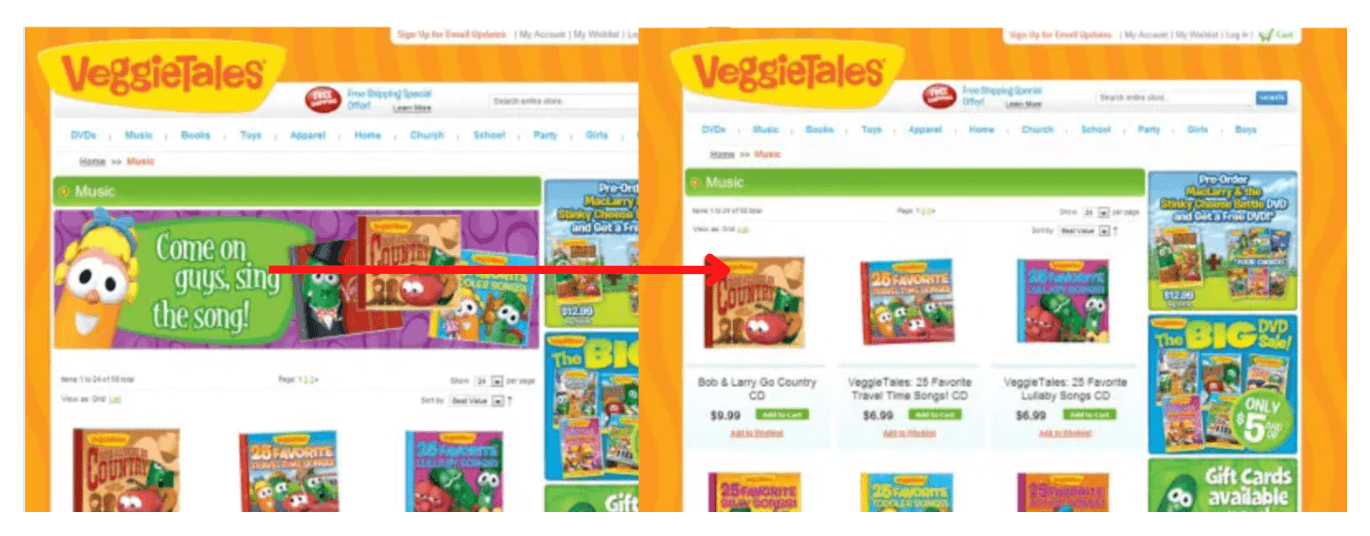
For example, the TV series VeggieTales tried testing a hypothesis of whether dropping the large and bright banners on the category pages would result in a higher RPV. They learned that without the banner, the category pages produced a 17.4% increase in RPV.
What’s next?
So you’ve set your KPIs and run your A/B test, now it’s time to take action based on the results. If one variation is statistically better than the other, you have a winner. You can complete your test and disable the losing variation.
However, if neither variation is statistically better, you've learned that the variable you tested didn't impact the results. If this happens, run another test or stick with the original variation. You can use the data and lessons you learned to figure out what to test next.
At the end of the day, remember that the only failed test is one in which you don’t learn anything. Tests that provide you with insights and allow you to better understand customer behavior give you an opportunity to learn, iterate, and essentially do more effective testing in the future.


Product marketing insider
Thank you for subscribing
Level up your product marketing career & network with product marketing experts.
An email has been successfully sent to confirm your subscription.
 Follow us on LinkedIn


.svg)
Start the conversation
Become a member of Product Marketing Alliance to start commenting.
Sign up now