


How many times have you heard an anecdote about a founder or CEO deciding to focus on a customer segment just based on a hunch?
Often this is because the company doesn’t have the right tools or frameworks to take a data-based approach to identify their segments, so they fall back on opinions and personal beliefs, without testing internal assumptions.
Unfortunately, this is more common than you might think. Over 50% of marketers say that they don’t have sufficient data and insights to deliver the relevant experiences they know their prospects and customers want.
As a product marketer, I’ve experienced this pain myself. That’s why I created a simple, easy-to-apply framework that helps businesses identify their best customers without needing expensive software or a team of data analysts.
I call this the MAP model, and there are three key stages:
To MAP your best customers using this method, all you’ll need is access to your customer database and a spreadsheet tool. Depending on your level of comfort with data analysis and exploration, you may want to partner with a colleague on your data team for a portion of the exercise.
However, it’s important to note that this isn’t required, and a lack of access to a data analyst should not prevent you from completing your customer segmentation, it may just help to accelerate it.
Before we jump into how the model works, I want to share what I mean by “best customer”. When it comes to customer segmentation, many folks just look at which customers make up the majority of their customer base and decide to focus on that segment.
But, this doesn’t take into account a handful of key considerations such as that segment’s performance and impact on your business, or your company’s ability to capture that market.
The MAP model is intended to provide a holistic approach to customer segmentation to ensure that when you attract more customers, you improve your retention rates. As these customers start to make up a higher percentage of your customer base, you’ll be able to drive positive impacts to revenue growth.
To put this into perspective, let’s look at an example. In the chart below, you’ll see business metrics associated with three fictional customer segments and a group of non-segmented customers.
Here we can see that the “other” group - customers who fall outside the target segments - form 40% of the customer base, and have both a higher customer acquisition cost (CAC) and a lower conversion rate.
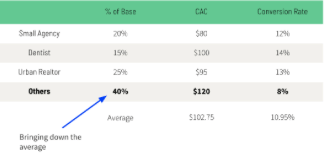
Their customer acquisition cost is $120, which is $40 more expensive than Small Agencies, the most affordable segment to acquire, and $20 more expensive than Dentists, the most expensive target segment to acquire.
This mix of customer acquisition costs increases your total CAC to $102.75 - well above the CAC for each of your target segments - and brings the average down for conversation rate.
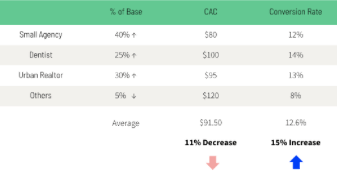
But, if you were able to increase the ratio of the high-performing segments in your customer base and decrease the amount of non-segmented customers to only 5% from 40%, you could have a massive impact on business metrics.
Now we can see that by increasing the ratio of segmented customers we have decreased our total customer acquisition costs by 11% and increased our conversion rate by 15%. This just goes to show that by acquiring and retaining more of your best customers, you could have a major impact on business performance and growth.
We’ll review how to research this performance data once we get to Stage 2 of the MAP model, but for now, let’s start at the beginning with Stage 1: Measuring volume.
Stage 1: Measure volume
Building a data set
The foundation for your customer segmentation is an accurate and robust data set. It’s important to start by looking inside your business at your existing customers before looking outside at the market opportunity.
It’s most likely you won’t have the ideal data set prepared and ready to go. Because we want to cross-reference a bunch of different data points about your customer, chances are you’ll need to build a new data set that merges all of the data you’ll want to use at an account level. The output should be a spreadsheet that you can use to manipulate, slice, and dice the data throughout the different stages of your research.
There are four categories of characteristics used for segmentation. These are demographic, geographic, psychographic, and behavioral. At this point, you won’t necessarily know which categories you’ll want to use to segment your customers.
For this reason, we want to make sure you’re building as robust a picture of your customers as possible by combining everything you have access to for each of those four categories. You’ll also want to combine all of those data points with any account and business data you may have accessible for those customers.
For example, combine their initial conversion rate, their recurring revenue or lifetime purchase total, and the start and end date of their subscription (if it’s a subscription business).
The level of information available to you will depend on your company type. If you work at an SMB or consumer SaaS company, you’ll probably have access to more data than you could ever use.
If you work at a company with a physical product, you may have less product or behavioral data. But, the good news is that you don’t need a complex data set. You just need enough data to start to spot patterns and trends amongst your customer base.
For this master data set, you’ll want to include data for all current customers, as well as any customer who has used your product in the past (even if they’ve churned or were just on a free trial).
We’ll start to sort this data by performance in Stage 2 and filter out low-performing customers, but we want to make sure we have a full historical picture, to begin with. Sometimes knowing who your worst customers are is just as important as identifying your best customers.
When I’m building this type of data set, I use the four categories we’ve already discussed as a foundation, and then I also add a new category called account data.
Account data will cover most of the key information you need to calculate an individual customer’s business impact, such as subscription start date, monthly recurring revenue amount, and current paying status.
Here’s a breakdown that shows how all five of these categories connect to provide you with that comprehensive view:
1) Account data
Goal:
Link account data to business impact
Examples of data points:
- Subscription start date
- Billing interval (monthly/annual)
- Subscription plan type
- Monthly recurring revenue
2) Demographic
Goal:
Identify key demographic characteristics
Examples of data points:
For B2B:
- Business size (employees, revenue)
- Business vertical or industry
- Job title
- Education level
For B2C:
- Age
- Income
- Marital status
3) Geographic
Goal:
Identify a geographic location
Examples of data points:
- Country
- State
- City
- Neighborhood (postal or zip code)
4) Behavioral
Goal:
Link product usage to the account value
Examples of data points:
- Adoption of key features (Y/N)
- Depth of feature usage
- # of logins
- # of users
5) Psychographic
Goal:
Understand the human behind the account
Examples of data points:
- Whatever info is available (if any)
Each of these five categories provides a different input to your data set. The account data links your customer accounts back to business impact, and, as discussed, may include information like billing interval or recurring payment amount.
Demographic and geographic data (gained via geographic segmentation), identifies characteristics such as employee size, job title, and location, and behavioral data links product usage to the account value by highlighting an account’s depth and frequency of usage.
Behavioral data is important because you want to identify customers who are not only having a positive business impact but are also extracting value out of your existing product.
Many businesses may not have mass-level access to psychographic information unless they’re actively surveying their customer base and linking it back to the account level.
For example, a company like Headspace that offers digital meditations may capture some psychographic information at signup (like how calm or open-minded a customer is, perhaps).
However, for the average business, this type of information is often collected through small-batch surveying or customer interviews. A data request form template can be used to identify the core pieces of data you want to include in your data set from each of the suggested categories.
This’ll make it easy for you to submit your request to the data team, or whoever else can help you collect the data. If you need help rounding out your data set, there are external tools available to supplement your existing data.
At Unbounce, when we completed our customer segmentation exercise, we ran our data set through Clearbit to enhance the information we had on each account. This helped us fill in the blank information, like business size and industry, for legacy customers who signed up before we had implemented our sign-up survey.
Again, this step isn’t required but could help you gain more information that might be valuable to identify the right segments.
Once you’ve identified and sourced the key pieces of data you need for your data set, you’ll need to merge the data into one usable spreadsheet - you’re now ready to start your analysis!
Pattern identification
The first part of your segmentation analysis will focus on clustering your customers based on similar attributes to identify patterns.
We want to group customers into potential segments based on common attributes found in the account data, demographic and geographic portions of your spreadsheet.
These attributes must be something you can use to easily identify potential future customers as well, and not something you can only see once a customer has used your product.
If you’re not able to easily identify and categorize both prospects and customers, it’ll make your segmentation work difficult to apply to your business on an ongoing basis.
To start identifying patterns, sort the data in your spreadsheet by volume. The goal is to identify three to five groups of customers who represent a large portion of your customer base.
If these customer groups make up a significant portion of your base, it’s most likely you’re successfully attracting and retaining this type of customer today. This’ll form the basis for your hypothesis, which we’ll do the work to validate in Stage 2.
Case study: monday.com
Here’s an example of what this step may look like for a self-serve project management tool, like monday.com.
For this example, imagine that the product marketer has compiled their data set, and has started slicing and dicing to find patterns.
They discover the following: the majority of customers are located in the United States, Canada, and France; they serve over twelve different industries, but have a large concentration in Software, Online Education, Construction, and Digital Agencies; and their customers most often want to collaborate with somewhere between 2 - 10 team members.
At this point, the product marketer may be tempted to look at this data and make a recommendation that the company should focus on Software companies in North America that have teams that want to collaborate with up to 10 colleagues.
However, this assumes that this segment isn’t just the largest segment, but also the best segment. But, this isn’t necessarily true. We need to cross-reference this volume data with performance data to truly understand which segments to focus on.
Once you’ve identified your patterns in the data, write down and document your segment hypothesis. It’s important to document your work so your internal stakeholders can follow along and for future reference if need be. Your segment hypothesis doesn’t need to be complicated, it just needs to provide you with an assumption to validate with performance data.
For example, in the monday.com hypothetical situation we’ve just discussed, their segment hypothesis may read:
“We believe our best customers are Software, Construction, Online Education, and Digital Agencies who are located in North America and are large enough to sustain teams of up to 10 employees.”
Before moving on to Stage 2, make sure you’ve completed the analysis, selected your three to five potential segments, and written your hypothesis.
Stage 2: Analyze performance
In Stage 2 of the MAP framework, we want to validate your segment hypothesis and analyze the performance of your selected customer groupings.
It’s important to look at the complete lifecycle of these customers to validate that not only are you attracting large amounts of this target segment, but you’re also able to expand and retain them too.
Here are five key performance data to include in your analysis:
- Conversion rate: How likely is this segment to convert into a paying customer
- The average revenue per unit, or ARPU: Does this segment pay more or less for your product than the average customer?
- Retention rate: Does this customer segment outlast other types of customers?
- Churn rate: How many of these customers do you lose every month?
- Lifetime value: Is the expected lifetime value of this customer segment higher than the average customer?
You should have all of the input data you need to complete this analysis in your master dataset spreadsheet, but it’ll be at the individual account level, and not the aggregate segment level.
To answer these questions for each potential customer segment, we’ll need to do a bit of extra work. Let’s walk through how you can calculate each metric for your potential customer segments.
Conversion rate
The first metric is conversion rate, which is the percentage of customers within each segment who convert into paying customers.
This metric is important if you have a free trial and freemium business model, or if you have a self-serve buying flow where prospects can purchase without going through a sales rep.
If you work in an enterprise sales model business, you may be tracking win rate vs conversion rate. Either way, we want to understand how likely we are to convert a prospect in this segment based on the performance of existing customers in the same segment.
To calculate conversion rate, divide the number of customers who converted by the total number of customers who were eligible to convert.
For example, imagine a business that had 1000 free trials last month that identified itself as an E-Commerce company. But, at the end of the free trial period, only 600 of those trials converted into paying customers. The E-commerce segment conversion rate would be 60%.
You’ll want to calculate the conversion rate for every potential segment identified as well as the average conversion rate for the total customer base. Knowing the average conversion rate will help you to identify if your potential segment’s conversion rate is higher or lower than the average customer.
Now, while knowing the conversion rate for the previous month is helpful, it isn’t enough to inform a business decision. To increase confidence in your ability to sustainably convert this segment, you’ll want to look at the conversion rate over a longer time horizon.
If possible, it would be ideal to have at least 12 months of conversion data to ensure that the previous month wasn’t just an anomaly and that seasonality is taken into account.
ARPU
The second metric we want to calculate is the average revenue per unit (or per account), which is often shortened to ARPU or ARPA.
This metric helps us understand how much a customer segment pays on average for your product, and how that compares to a non-segment customer. This should not be confused with the willingness to pay, however, that’s also an important step to understanding how your segment views value. But, for now, ARPU will act as a signal.
To calculate average revenue per account, take the total invoice amount across every customer in that particular customer segment for a while (let’s say a month), and then divide it by the number of paying customers in that segment.
For example, imagine a company invoiced $100,000 from 100 Agency customers last month. The average revenue per account would be $1000. If the ARPU of a different segment, says Design Firms, was only $70, then you would have a signal that agencies would be more likely to pay more money for your product.
Again, same as the conversion rate, we want to calculate this over a while, like a year, to ensure that this is a reliable number.
Retention and churn rate
The next metrics to measure are retention rate and churn rate, both of which are incredibly important for subscription business models.
Retention rate is the percentage of customers you retain within each customer segment over some time.
 Gareth Watkins
The churn rate is the opposite of retention and is the percentage of customers you lose during a period of time.
Lawrence Chapman
If a potential segment has a high retention rate and low churn, then this shows they extract long-term value from your product. It will give you confidence that as you bring in more of these customers, you will also be able to retain them in the long run.
To calculate retention rate, divide the number of active customers within your segment who continue their subscription by the total number of active customers in that segment at the beginning of the time period.
To calculate customer churn rate, divide the number of customers who leave your product by the total remaining customers within that segment. Most subscription businesses calculate both retention rate and churn rate monthly.
To understand how survivable a customer segment is over time, and not just during one particular month, you need to measure the retention rate throughout their lifecycle using cohort analysis, which we’ll focus on shortly.
Lifetime value
Before we move on to cohort analysis, we need to calculate customer lifetime value by segment. Customer lifetime value, or LTV as it’s usually referred to, is the total amount of revenue you can expect to gain from an account during their lifetime as a customer.
To measure LTV, you need to calculate the average purchase value, and then multiply that number by the average purchase frequency rate to determine customer value.
Then, once you’ve calculated the average customer lifespan, you can multiply that by customer value to determine customer lifetime value. That sounds like a lot, so let’s simplify this using an example.
Kissmetrics published a report that breaks down the LTV for Starbucks. Their report measures the weekly purchasing habits of five customers, then averages their total values together. By following the aforementioned steps, we can use this information to calculate the average lifetime value of a Starbucks customer.
The report says the average Starbucks customer spends $5.90 each visit. This number is the same metric as average revenue per account, which we already calculated above for our segments. After calculating the average spend, the next step is to measure the average frequency of purchase.
For Starbucks, the average number of purchases in the report was 4.2. Based on these two inputs, we can calculate customer value. To do this, we have to look at all five customers individually, and then multiply their average purchase value by their average purchase frequency rate. This lets us know how much revenue the customer is worth to Starbucks within the course of a week.
Once we repeat this calculation for all five customers, we average their values together to get the average customer's value of $24.30. We now have the average customer value as well as the average customer lifespan (the report says this is 20 years for Starbucks), and we can use this data to calculate LTV.
In this case, since we were measuring customers on their weekly habits, we need to first multiply their value by 52 to reflect an annual average.
After that, multiply this number by the customer lifespan value (20 years) to get the LTV. For Starbucks, their customer lifetime value equals $25,272.
Cohort analysis
Now that we understand the core metrics we want to measure for our potential segments, let’s take a quick look at cohort analysis, a tool you can use to help identify performance patterns over time.
By definition, a cohort is a group of people with a shared characteristic in a specified timeframe. In the context of business, there are two types of cohort analysis: acquisition and behavioral.
An example of an acquisition cohort could be customers who’ve bought your solution in March, or prospects who signed up for your free trial in the last 30 days. An example of a behavioral cohort could be a customer who adopted a certain feature in February or a customer who canceled their subscription in the last 60 days.
Unlike when you look at your users as a single unit, cohort analysis enables you to break users into groups and pinpoint patterns.
There are three essentials to keep in mind when it comes to cohort analysis. The first is defining your cohort. This could be by customer demographics, like gender and location, or campaign source, channel source, device, or lifecycle stage. For our customer segmentation exercise, your cohort will be each of your potential customer segments. For example, a cohort may be Agencies in North America.
The second essential is to understand which metric you’ll apply to your cohort. We want to ensure we’re running a cohort analysis for our retention rate, but we could do this for a customer metric like lifetime value.
And finally, the third is to define the period you’ll be measuring. This’ll depend on your circumstances and for some businesses daily might make perfect sense, but for others, it might be more like weekly, monthly, or even quarterly.
After you’ve used your data set to calculate each of these customer metrics, using both cohort analysis and the calculation formulas provided, you can fill in the information in your segment hypothesis framework to form a complete picture of the performance of each customer segment.
You’ll want to compare each of the segments against each other to see which ones bring more value to the business, and which ones might not be as valuable as you originally thought.
As you compare each of these segments against each other, you’ll also want to compare them to the average customer as well, to make sure they’re truly your company’s best customers.
Remember that example we provided, where the non-segmented group of customers was drastically bringing down the average performance on both customer acquisition cost and conversion rate? This is your opportunity to turn those numbers around by selecting customer segments that’ll increase the average performance of your base overall.
Before moving on to Stage 3: Prioritize potential, you’ll need to select one to three segments you want to proceed with based on this performance analysis.
Stage 3: Prioritize potential
Once you have identified your largest groups of customers by volume and then validated their performance, it’s time to prioritize your segments. This final prioritization step looks at your potential to win a particular market should you choose to focus on it.
There are three main categories we recommend using to assess a segment’s potential: addressable market, customer acquisition costs, and competitive landscape.
Addressable market
Total addressable market, or TAM for short, is the total amount of demand that exists in the market for your product or service. For example, if your company sold memory foam mattresses, the total addressable market would be the worldwide mattress market, which could be calculated as the number of people who could use a mattress multiplied by the average cost of a mattress.
The size of the TAM is probably what made your company build your product initially, but it’s not going to help you assess if a specific portion of that market could be appealing to focus on. If you’re going to invest your company’s resources into winning a segment, you want to make sure that the market is large enough to sustain your growth ambitions.
Before taking on a new segment - whether that's a vertical, geography, or moving up or down market - you need to be confident that you’ll be able to achieve high enough revenue growth, otherwise, the investment of your time and money won’t be worth it. This type of market sizing is often referred to as the Serviceable Available Market or the SAM.
The SAM is calculated by breaking down a large total addressable market into smaller segments that different companies can own. In our mattress example, while the total addressable market was the worldwide mattress market, the SAM might be the memory foam market in North America.
Alternatively, if you’ve identified that buyers between the ages of 20 to 35 are your ideal segment, you might want to break your SAM down even further to look at this specific group.
The SAM provides a realistic view of how much revenue you could potentially make from a segment, while the TAM helps you understand the larger growth potential of all segments combined.
Calculating addressable markets can be quite a complex activity that product marketing may be involved in, but it’s often owned at the executive level. Within the context of customer segmentation, we don’t necessarily want to completely redo your company’s addressable market work, but we do want to ensure we’re providing key inputs and making responsible business decisions.
To put it simply, we want to calculate the market size for each segment as well as assess if that market is growing, declining, or stabilizing.
Here are a few questions you will want to be able to answer for each segment:
- How many businesses or consumers exist in this market today?
- How many new businesses or consumers can we expect to be introduced to the market each year?
- What is the long-term projected growth rate for this market?
- What percentage of this market would require a product or service like yours?
- And, what percentage of this market currently has a solution?
To get the answers to these questions, you’ll need to dig into analyst reports, census data, and any other sources that can provide market-level data. Once you have the answers, you’ll be able to assess the viability of each of your proposed segments.
Perhaps before you completed the market sizing, you were weighing two potential segments against each other. One may have seemed more appealing just based on its performance data in your customer data set, but once you layered on the addressable market work, you found that this market is declining in size, while the other market is growing significantly year over year.
You may be willing to select the customer segment with slightly lower performance and a much larger market, knowing you can work to increase performance over time with focused go-to-market strategies.
Customer acquisition cost
The second component of Prioritizing Potential is assessing each segment’s customer acquisition cost.
Customer acquisition costs, or CAC for short, encompass all sales and marketing costs incurred to acquire a new customer. This could include advertising spend, sales commissions, and marketing and sales salaries.
The ideal LTV: CAC ratio is often cited by experts as 3:1. This means that the value of a customer is three times more than the cost to acquire them.
In a SaaS business, not only do you calculate CAC, but you also look at the CAC payback period. CAC payback helps you see how long it’ll take for you to earn back the money spent to acquire that new customer.
A high payback period indicates that you may be spending too much on the acquisition, while a low number could signal you’re spending too little.
While you shouldn’t be optimized for your customer segments by solely looking at CAC or CAC payback, it’ll help you understand if you currently have a viable acquisition strategy and Go-to-Market motion for a particular segment, and if that acquisition strategy is scalable.
Again, think back on that example from earlier. The non-segmented customer group had a significantly higher customer acquisition cost than the three target segments.
In that hypothetical example, when the company was able to prioritize the three target segments with a low CAC, they were able to decrease their overall CAC by 11%. This is a great example of how knowing the CAC of your segments can impact your growth projections.
Competitive landscape
The third element of prioritizing potential is reviewing the competitive landscape. Understanding if your competitors are prioritizing your segments will have a major impact on your Go-to-Market strategy and product positioning, and may even make you step away from a potential segment.
On one hand, if you have a segment that many competitors are going after, you’ll need to be confident in your key differentiators to ensure you can capture that market.
The market will most likely be quite competitive because of the various solutions available, which could drive up your acquisition costs and increase your churn rate. On the other hand, if you have a segment that is currently ignored, you may have an opportunity to win that market with significantly less effort.
To assess which segments a competitor is prioritizing, you will need to do some sleuthing. The level of difficulty of this task will depend on the availability of public information.
If you’re in a consumer, SMB, or product-led market, information should be easily accessible on your competitors’ websites - you’ll just need to invest time in conducting competitive intelligence. However, if you work in a B2B enterprise market, this information may only be available through customer intel or mystery shopping.
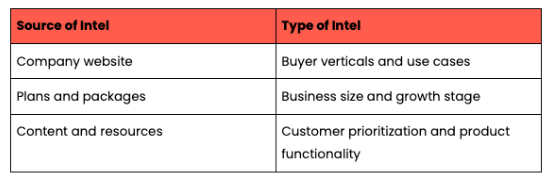
There are a handful of key places I usually look to identify which segments a competitor is focusing on: the competitor’s website, their plans, and packages, and their content and resources.
Company website
The first source of intel is a competitor’s website. The website is a great place to identify their buyer verticals as well as major use cases. Both the website’s key messaging, as well as their navigation menu, will provide clues into their segments.
Here are two examples: On the Miro website, their Solutions drop-down shows that they are focused on Product Development, Lean & Agile, and UX Research & Design use cases.

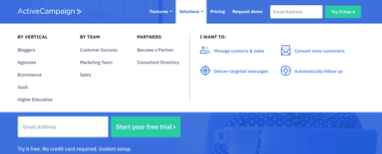
On the ActiveCampaign website, clicking into their Solutions menu reveals they’re focused on five different verticals and three different types of teams. This information is incredibly easy to source and provides you with instant insight into which customer segments these companies are targeting.
Plans and packages
The second source of intel is a competitor’s pricing, which may be available on their website or through sales collateral.
A competitor’s pricing will often provide a view of how a customer may describe themselves, not to mention the price of their product. Establishing their prices will help when setting your product selling price. In B2B software especially, packages are often named after specific customer segments or business growth stages.
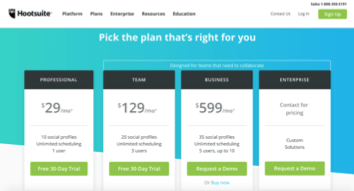
For example, by looking at Hootsuite’s pricing page we can see that they are targeting two different segments: social media professionals who use the software on their own and teams that need to collaborate (particularly teams of three to ten).
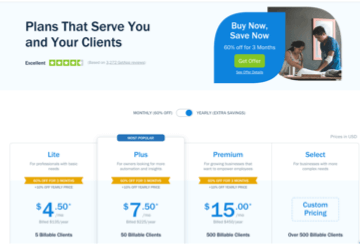
Here’s a second example, this time looking at the FreshBooks pricing page. While their package names are fairly generic, each one includes a sentence-long description.
We can see that FreshBooks is targeting a few different segments, including small business owners with fairly basic needs, growing businesses with teams, and large businesses with complex needs. This level of information will help you narrow down the size of the business your competitor is targeting.
For example, from their navigation menu, you may have discovered your competitor is targeting a particular vertical or industry, but their pricing page may indicate that it’s a small team of five working within that industry that they are prioritizing vs a large enterprise within that industry.
Content and resources
The third source of intel is your competitor’s content and resources that they produce for their customers. The content they create will give you a glimpse into their target customer segments and product functionality, as that content is often produced not just for prospects, but also users.
Competitive content could include many things, such as their blog, resource page, documentation, help center, or even product templates. I highly recommend you sign up for your competitor’s blog to ensure you’re staying up to date on all of the new content they create, as this may alert you to a shift in their own segmentation.
In the example below, we can see that Asana has a publicly available templates gallery on its website. In the gallery, they showcase templates for seven different teams within an organization, which helps us identify their main users.
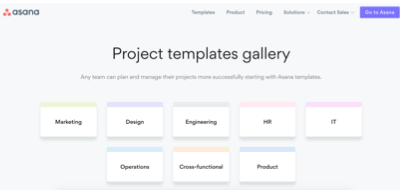
This is just one example of how customer resources can help you narrow down a competitor’s target segments and use cases.
Sleuthing your competitors is a bit like a game of Clue - you need to gather all of your evidence before concluding. While you complete this research and go through your sources of intel, ask yourself:
- Which verticals or industries is my competitor targeting?
- What is the size of my competitor’s customers? What stage of growth are they in?
- What use cases is my competitor promoting for these customers?
- Does there seem to be a prioritization or ranking amongst these identified segments?
- Again, just because a competitor is prioritizing a segment does not mean you shouldn’t also prioritize that segment. It’ll just help you assess each segment’s competitiveness before making your final selection.
Selecting your segments
Once you’ve completed Stages 1, 2, and 3 of the MAP framework, you should have a comprehensive segment hypothesis and enough information to make a formal recommendation on your target segment.
To recap, we started with your entire customer base and built high-volume groups based on common attributes. This helped us narrow down a handful of potential segments for your business to focus on.
We then layered on performance data to identify which groups of customers not only make up a major portion of your customer base but are also high performers. This is important because as you focus on attracting and retaining more of this segment, you want to ensure they will boost business performance overall.
And finally, we looked at the potential for your business to acquire more of these customer segments based on market sizing, acquisition costs, and competitiveness.
As you prepare your final recommendation, review your segment hypothesis worksheet and decide which tradeoffs make the most sense for you when selecting your segments.
In the end, you may have multiple segments that all seem appealing, and you’ll have to decide whether a large market opportunity, a less competitive market, or higher business performance is important. There’s no one right answer here, and it will vary from business to business.
When selecting your segments, it’s important to remember that focus is the word of the day. You may be tempted to move forward with five segments if they all look promising, but in the end, you’ll want to narrow it down to one to three core segments.
In the future, as you roll out your segmentation and start seeing positive results, you’ll be able to revisit this exercise to start expanding into adjacent segments.
How to improve customer segmentation
Ready to refine the art of value-based segmentation?
This segmentation certification covers all the essential principles and frameworks of a key product marketing principle - irrespective of where you are in your journey.
Looking for product-market fit? Wanna compete in a saturated market? Perhaps you’re aiming to define a new category? Whatever your goal, segmentation will help you take a customer-obsessed and focused approach to driving sustainable growth.
This course will equip you with the skills to:
✅ Build value-based segmentation
✅ Identify your best customers
✅ Discover customer value
✅ Establish how much your customers are willing to pay
✅ Build high-converting Go-to-Market strategies
✅ Measure segmentation success
✅ Articulate and understand the benefit of customer segmentation
✅ Apply segmentation across your whole organization and customer lifecycle.
Whether you’re a small startup or a large scale-up, it’s all here. 🔥


Product marketing insider
Thank you for subscribing
Level up your product marketing career & network with product marketing experts.
An email has been successfully sent to confirm your subscription.
 Follow us on LinkedIn


.svg)
Start the conversation
Become a member of Product Marketing Alliance to start commenting.
Sign up now